Call us on 01782 752 369 |
|
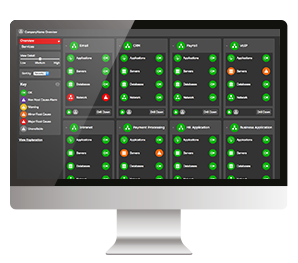
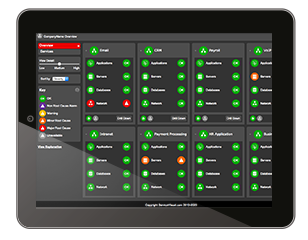
IT Service Performance Dashboards |
|
Call us on 01782 752 369 |
|
IT Service Performance Dashboards |
|
ServiceVisual is a Managed Service Company that delivers it’ solution within a hybrid cloud / on-premise architecture. In order to measure the status of the Configuration Items that make up our customers key application services, we strategically place our data collection agents within our customer environments and then send the encrypted results back to our ServiceVisual Data Centre. If you require a pure on-premise solution, our sister company KedronUK can assist you in building and configuring your own on-premise Application Service Monitoring Platform, with various levels of support available.
ServiceVisual is a combination of Professional Service engagement, Application Service Management and Visualisation Technologies, Processes and Support. To understand our high level architecture, please view this digram. For more in-depth information about our Service Architecture, please contact one of our Service Specialists.
To make sure we are able to on-board customer fast, and maintain their implementation efficiently, we focus our business on building the views that we believe IT Operations need and want to see; the Application Services and the infrastructure supporting those services.
Business Service Management usually involves the inclusion of Business Intelligence (BI) metrics from the customers BI Vendor which currently ServiceVisual does not integrate with. However, should you wish for a solution that can offer these additional metrics, our sister company, KedronUK can help with their range of On-Premise Solutions.
In any line of IT where you outsource, you loose some level of visibility as part of the “pay-off”. This is true when considering monitoring when you move to Software as a Service (SaaS) and Platform as a Service (PaaS) vendors. Although you may have less flexibility around monitoring in these scenarios, ServiceVisual can provide you maximum possible visibility and provides it’s users with the ability to monitor these Application Services alongside their self-hosted Application Services, in one Dashboard. We have several options available to us:
One of the key values of the ServiceVisual concept is our industry leading approach to service discovery, configuration and on-boarding. We have unique technology combinations, proven processes and workflows that means that a project that would take some vendors months to complete, takes the ServiceVisual team weeks and sometimes days. The actual timescale would depend on the following variables:
To get an estimate for your unique environment, book yourself on our free of charge, non-obligatory Technical Assessment.
Application Performance Monitoring focuses on monitoring the transactions and processes associated to a customers key applications. ServiceVisual includes aspects of this to measure the application components that make up and end to end service, but also intelligently monitors the network, host, VM, storage, database configuration items that work together to deliver the customer facing Application Service. It’s a true end-to-end solution that understand complex service configuration and performance and reflects that information in easy to understand dynamic dashboards.
Network management typically uses SNMP, ICMP, Netflow, Packet Capture to provide Network / Infrastructure Managers with visibility of the availability and performance of infrastructure resources. Usually this information is grouped by location or device type. Alerts and dashboards are then viewed in the context of “device”. ServiceVisual uses the above mentioned datasources where appropriate, and also captures other none network related measurements from applications, databases, storage and end user perspectives. More importantly it then understands how these components work together to deliver the end-user service and visualises that via dynamic dashboards and service centric alerts and reports.
Each service is different and requires a customised approach, but typically the following logic is applied by our experts
ServiceVisual strongly believes that to ask your Network, Application, Server, Database and Storage teams to abandon the 0perational monitoring tools that they know and trust is a big ask and causes political issues within organisation that can affect staff moral.
We offer an alternative approach, where we compliment those existing technologies with the Service Centric, End-to-End views and reports that Service Delivery Managers, IT Operation Managers and CTO’s want to see. By using our own technology stack, just to monitor the core service configuration items, it means we’re quicker, more cost effective and less disruptive.
The solution is priced on a monthly subscription price model. Monthly price is dictated by the number of services and the number of CI’s within that service. We are able to give accurate pricing for your unique environment following a free of charge and non obligatory Technical Assessment.
We are so confident in our technology, expertise and process that we offer a non contracted period for 3 months, where you can cancel at anytime. After this time we offer 1, 2 and 3 year subscriptions periods.
Measurement of your service CI’s is taken locally within your own network and so therefore is protected by your own ITSec strategy. The metrics are then sent back to our secure data centre via encrypted communication. The data sent back does not contain any payload and only includes binary performance data. Fore information on our IT Sec Policy click here.
Your key services are discovered and modeled by our experts, using our unique technology and processes. The results are then delivered as a Dashboard service, accessible within your NOC or via your mobile device.
We provide our dashboards and associated monitoring as a service from a secure, resilient datacenter.
ServiceVisual is not dependent on integration or replacement of your existing operational monitoring tools.
ServiceVisual is quick to deploy. We can be up and running in a matter of days not weeks or months.
Been down this road before with the big vendors and sound too good to be true?
We offer a free Proof of Concept around 1 of your IT Services.
Call one of our experts on 01782 752 369 or book a free consultation by completing the form.